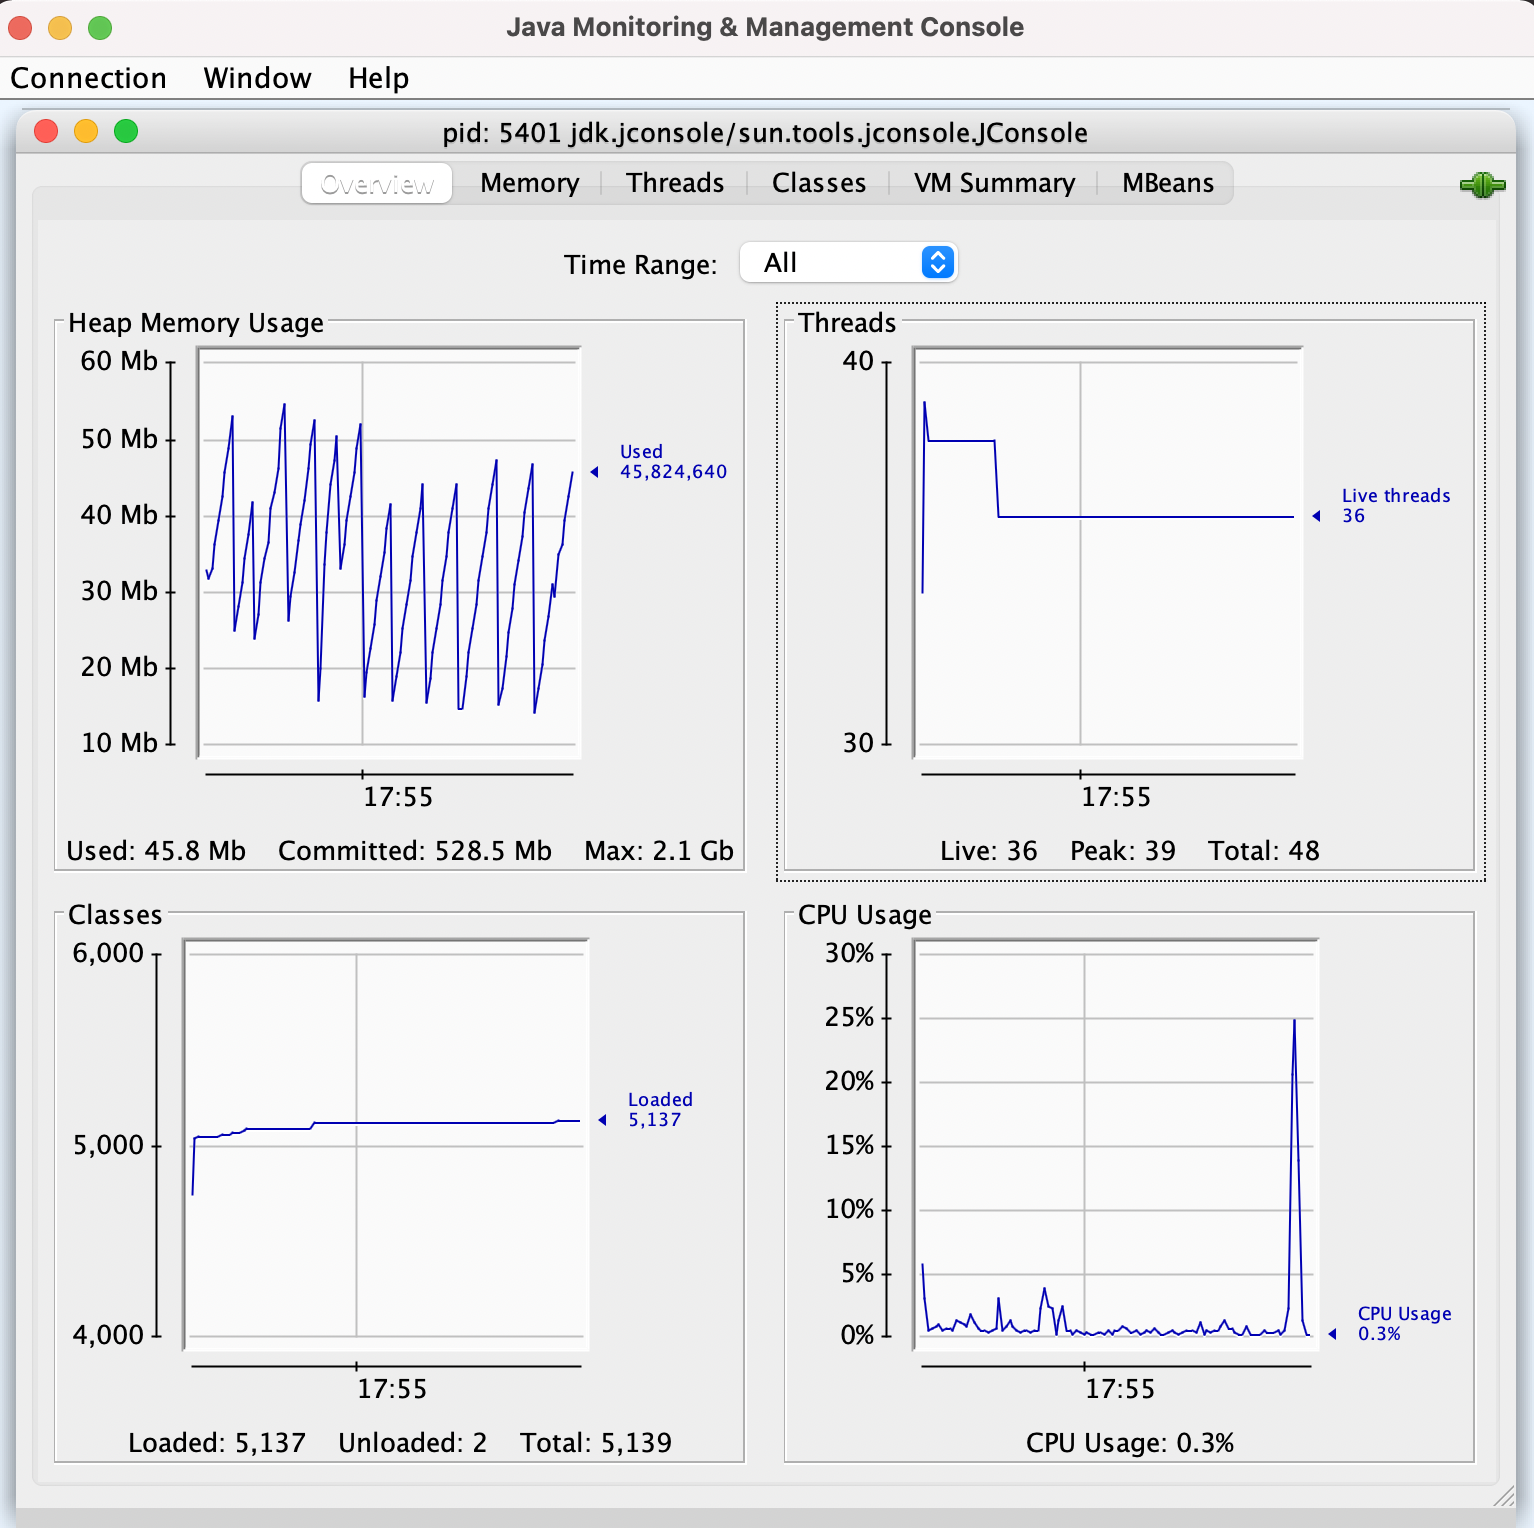
The Java Monitoring and Management Console - or simply called as jconsole is an advanced tool for Java developers to monitor and manage their Java Applications that are deployed on their local machine, or remote machines such as UAT (Staging) or Production environment. This tool comes very handily when there the developer wants to understand the following,
- What is the trend of the memory (heap) consumption of the application.
- To identify number of threads that are running (live threads).
- Total number of Classes that are loaded and currency in use.
- What is the trend of CPU utilization of the application over time.
How to Lauch jconsole using command Line?
Launching the monitoring tool is easy. just type jconsole in the command line (or Terminal if using Mac/Linux). You can also pass in optional parameters such as PID to launch the console with details of a JVM that you want to monitor.
Syntax: jconsole [ options ] [ connection ... ]When you fire this command the jconsole UI application will be launched and you will see something like this.

⚡️You can select the time range from 1 minute, 5 minutes, 10 minutes, 30 minutes, 1 hour .. 1 day, ... 1 month, ... 12 months... All based on what time the issue might have occurred that you want to understand.
jconsole various tabs
- Overview tab: Shows the graphs of Heap Memory Usage, Threads, Classes and CPU Usage,
- Memory tab: In this tab, you can see detailed charts of all kinds of memory areas such as Heap, Non-Heap, and various Memory Pool. You can also perform garbage collection here.
- Threads tab: It provides detailed information of all the threads - you can look into the thread stacks and even identify deadlocks here.
- Classes tab: Again this provided more detailed info about the classes loaded and their charts.
- VM Summary tab: It looks something like this,
VM Summary
Saturday, April 24, 2021, at 6:09:59 PM GMT

Connection name:
pid: 5401 jdk.jconsole/sun.tools.jconsole.JConsole
Virtual Machine:
OpenJDK 64-Bit Server VM version 11.0.9.1+1-LTS
Vendor:
Azul Systems, Inc.
Name:
5412@mac.local
Uptime:
22 minutes
Process CPU time:
1 minute
JIT compiler:
HotSpot 64-Bit Tiered Compilers
Total compile time:
27.076 seconds

Live threads:
38
Peak:
39
Daemon threads:
30
Total threads started:
51
Current classes loaded:
5,156
Total classes loaded:
5,158
Total classes unloaded:
    2


Current heap size:
69,452 kbytes
Maximum heap size:
2,097,152 kbytes
Committed memory:
516,096 kbytes
Pending finalization:
0 objects
Garbage collector:
Name = 'G1 Young Generation', Collections = 357, Total time spent = 0.446 seconds
Garbage collector:
Name = 'G1 Old Generation', Collections = 0, Total time spent = 0.000 seconds

Operating System:
Mac OS X 11.2.3
Architecture:
aarch64
Number of processors:
8
Committed virtual memory:
414,543,728 kbytes
Total physical memory:
8,388,608 kbytes
Free physical memory:
   61,648 kbytes
Total swap space:
2,097,152 kbytes
Free swap space:
  794,624 kbytes

VM arguments:
-Dapplication.home=/Library/Java/JavaVirtualMachines/zulu-11.jdk/Contents/Home --add-opens=java.base/java.io=jdk.jconsole -Djconsole.showOutputViewer -Djdk.attach.allowAttachSelf=true -Xms8m -Djdk.module.main=jdk.jconsole
Class path:

Library path:
/Users/code2care/Library/Java/Extensions:/Library/Java/Extensions:/Network/Library/Java/Extensions:/System/Library/Java/Extensions:/usr/lib/java:.
Boot class path:
Unavailable
Have Questions? Post them here!
- Get the current timestamp in Java
- Java Stream with Multiple Filters Example
- Java SE JDBC with Prepared Statement Parameterized Select Example
- Fix: UnsupportedClassVersionError: Unsupported major.minor version 63.0
- [Fix] Java Exception with Lambda - Cannot invoke because object is null
- 7 deadly java.lang.OutOfMemoryError in Java Programming
- How to Calculate the SHA Hash Value of a File in Java
- Java JDBC Connection with Database using SSL (https) URL
- How to Add/Subtract Days to the Current Date in Java
- Create Nested Directories using Java Code
- Spring Boot: JDBCTemplate BatchUpdate Update Query Example
- What is CA FE BA BE 00 00 00 3D in Java Class Bytecode
- Save Java Object as JSON file using Jackson Library
- Adding Custom ASCII Text Banner in Spring Boot Application
- [Fix] Java: Type argument cannot be of primitive type generics
- List of New Features in Java 11 (JEPs)
- Java: How to Add two Maps with example
- Java JDBC Transition Management using PreparedStatement Examples
- Understanding and Handling NullPointerException in Java: Tips and Tricks for Effective Debugging
- Steps of working with Stored Procedures using JDBCTemplate Spring Boot
- Java 8 java.util.Function and BiFunction Examples
- The Motivation Behind Generics in Java Programming
- Get Current Local Date and Time using Java 8 DateTime API
- Java: Convert Char to ASCII
- Deep Dive: Why avoid java.util.Date and Calendar Classes
- How to Create AWS SNS Topic using AWS CLI - AWS
- What is the Max and Minimum Value of int type in Python? - Python
- Add Bookmark macOS Safari - MacOS
- How to Clear Cache for a website (URL) in Safari for Mac - MacOS
- Java Generics explained with simple definition and examples - Java
- Bash Command to Download a File From URL - Bash
- PHP Code for sending Emails - PHP
- Fix: Invalid Gradle JDK configuration found. Could not find the required JavaSDK - Gradle